Comparing one user to others🔗
A very common way to end any kind of assessment is to generate a custom report for the participant. Often one of the most valuable pieces of information to share with them is how they compare to others you have assessed. You can do this in GuidedTrack leveraging custom services and setting up your own data tables.
This page will walk you through an illustrative example of how to make your GuidedTrack program compare the results of the participant to others.
Example: Comparing income to average🔗
Let's say you're building an assessment which contains a question about the participant's income. At the end of the assessment, you want to generate a personalized report for the participant to give them a sense of where they are compared to the population. One bit of information you might want to include is a chart showing them how their income compares to the average income of all survey takers.
To do this, you'll need to:
- Save each income collected in a table, so you can look them up later on.
- Create a custom service route that calculates the average income.
- Use the route created in step 2 at the end of your assessment to get the average income of all participants assessed.
- Generate a chart (via
*chart) of the participant's income in the final report.
Step 0: Create the assessment🔗
Before we do anything, we need an actual assessment to work with. For this contrived example, all we really need to know is the income, so let's just ask the participant for it. Then, we generate the most basic of final reports possible – simply showing the income they reported back to them. Here's the GuidedTrack code to do this:
*question: How much total income in U.S. dollars did you *personally* make during all of last year (before taxes)? *tip: Just your own personal income, not your household income *type: number *before: $ *save: income You reported your income at ${income} per year.Step 1: Create a custom service to work with participants🔗
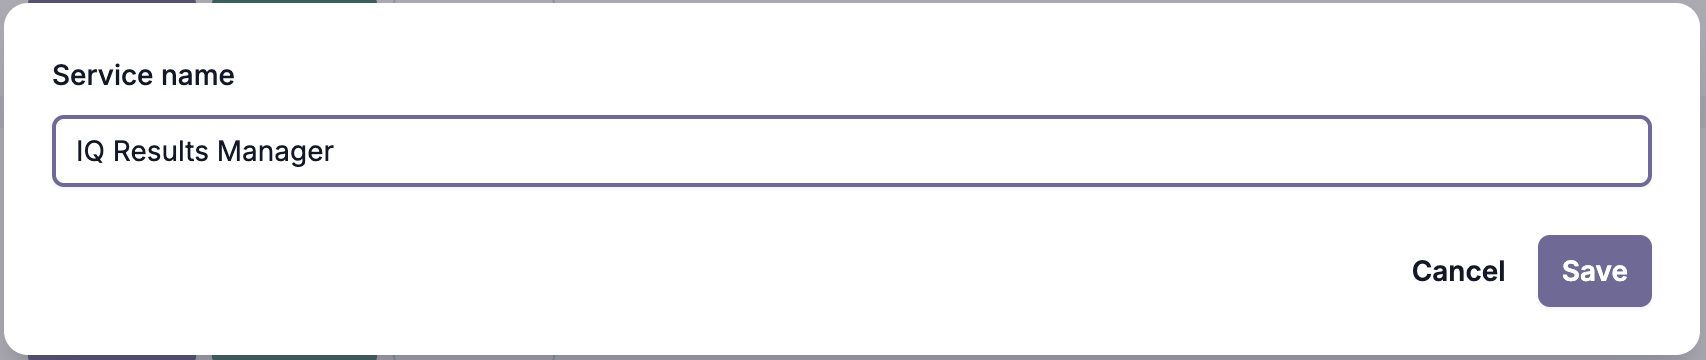
Next, create a custom service to manage data collected on the participants (income being one such piece of data). We'll call the service "Participant Database."
For more information on creating custom services, see Custom Services - Setting Up.
Step 2: Add a participants table and a way to add incomes to it🔗
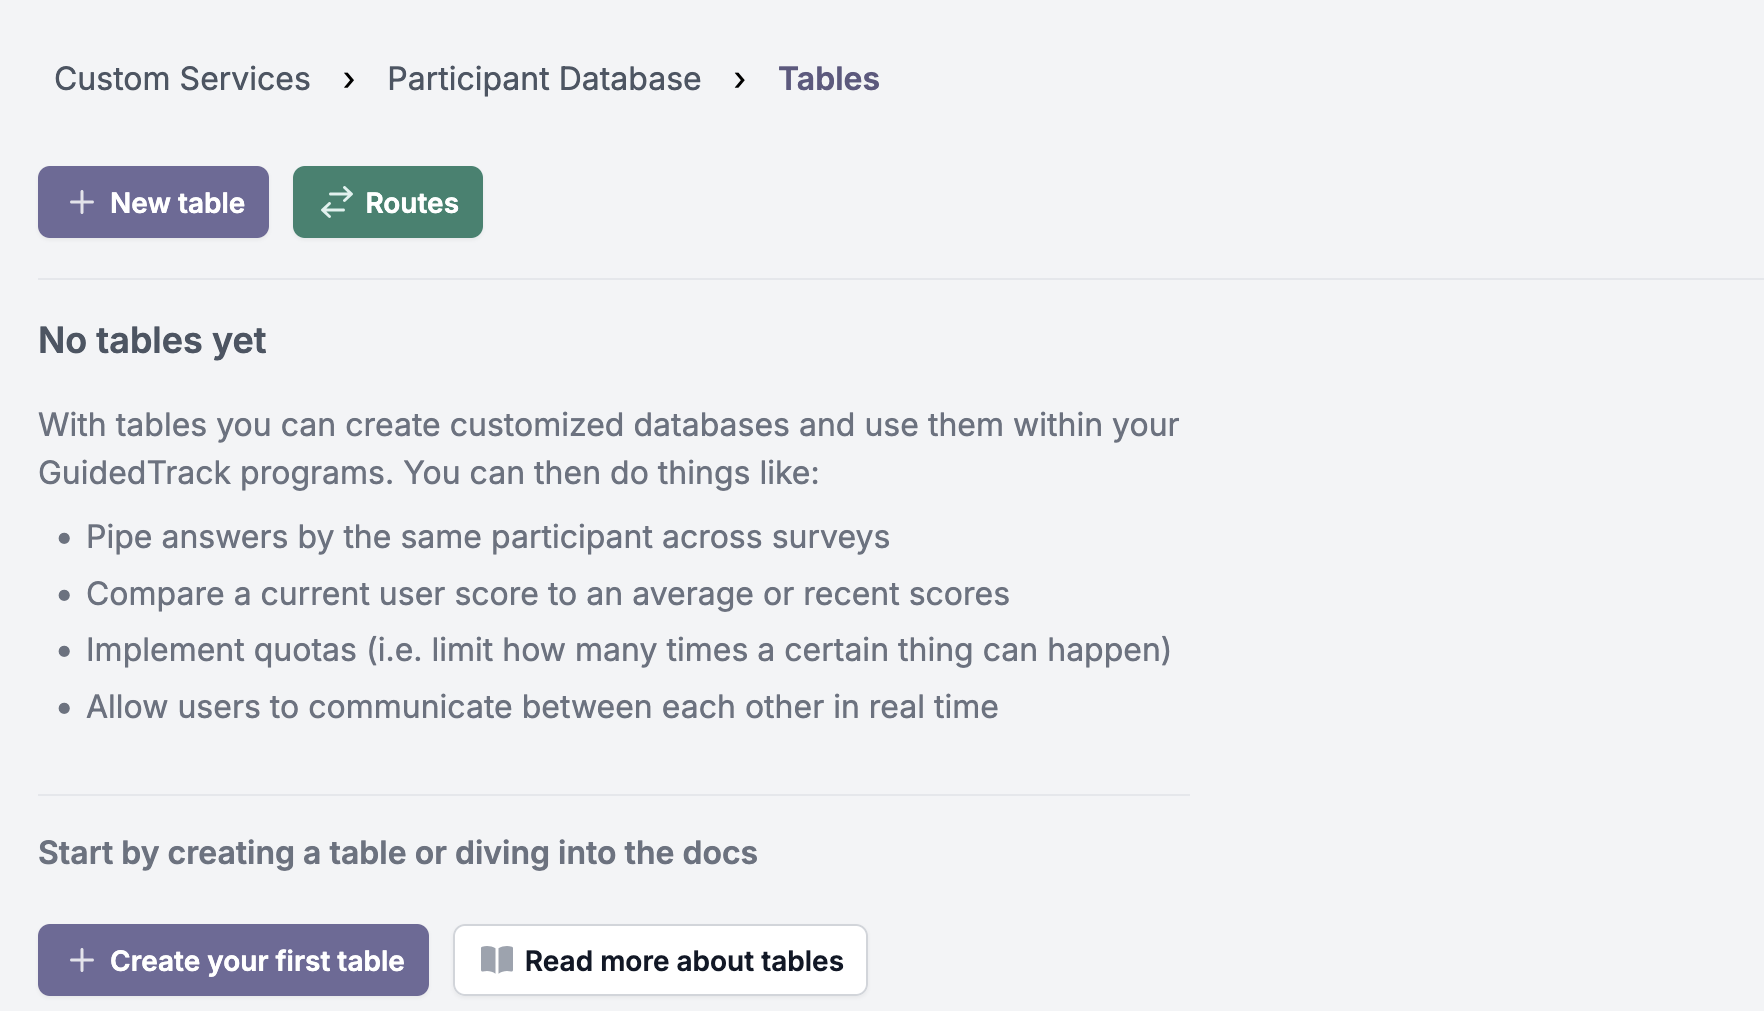
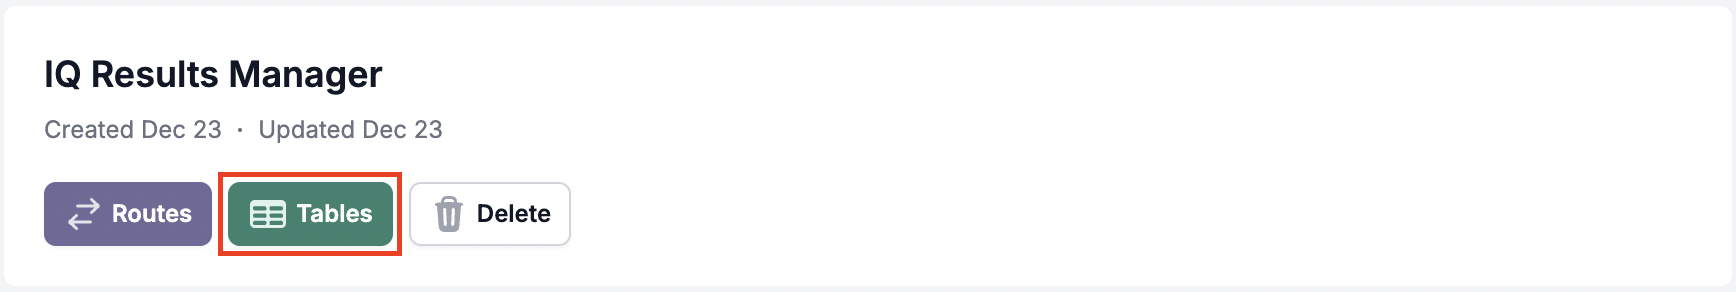
Once you've set up the "Participant Database" custom service, go to its "Tables" page and create a new table.
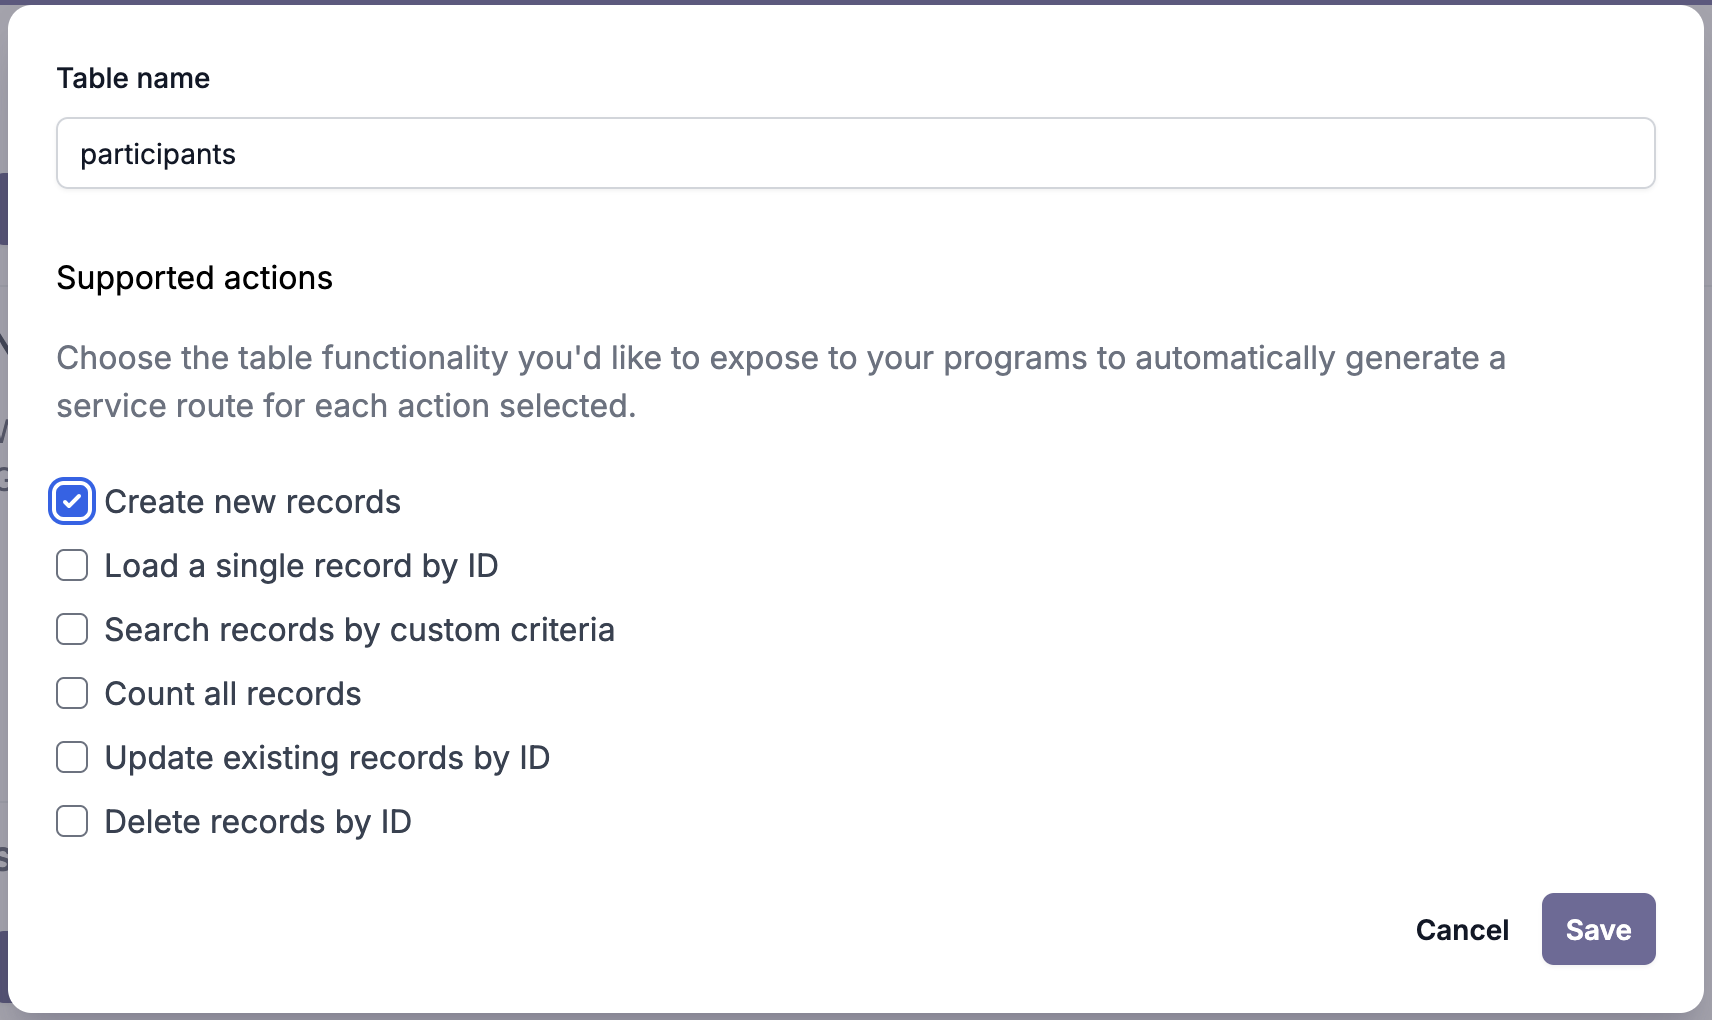
Let's call this table participants, and make sure to add a route to add to the table by selecting the "Create new records" action:
Step 3: Save each participant's income🔗
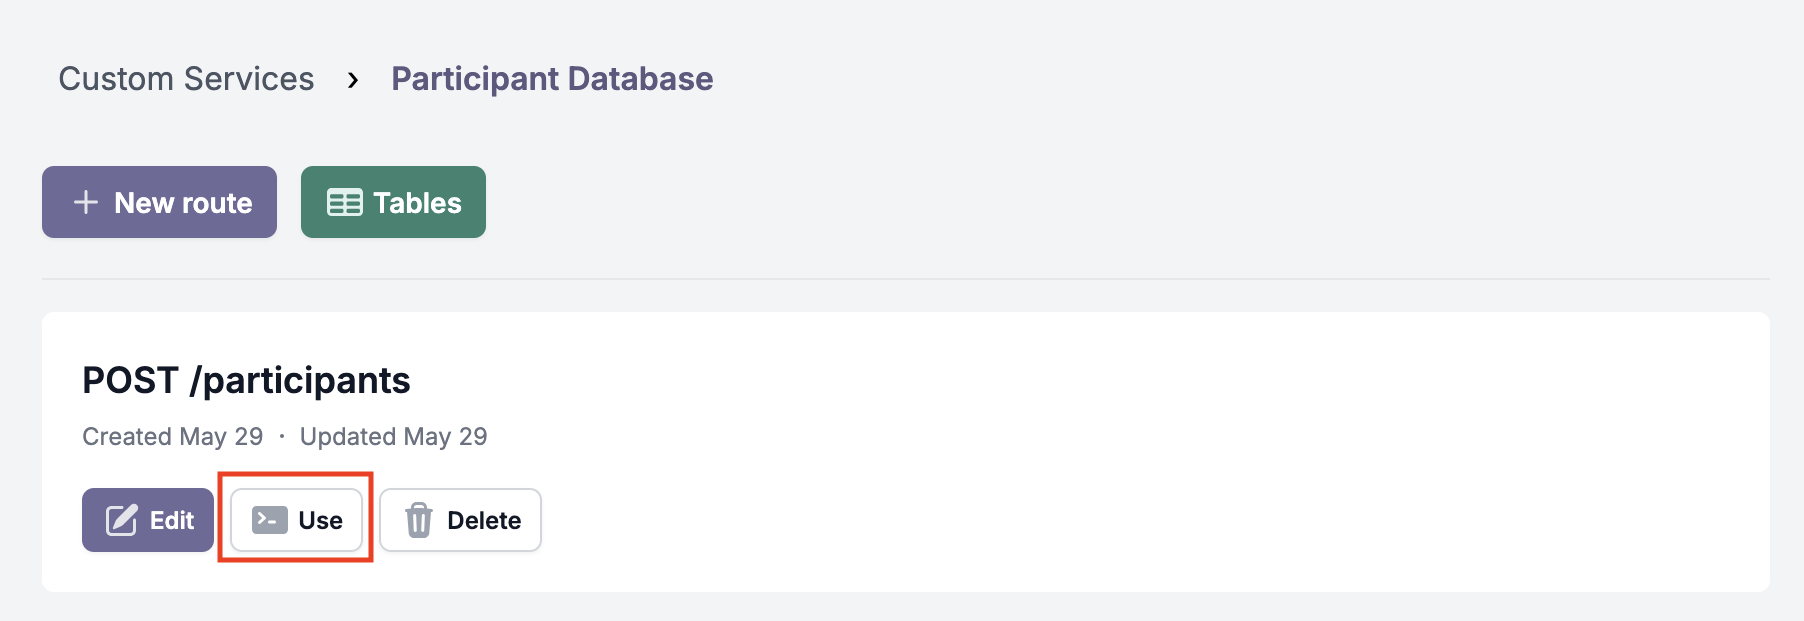
On the "Routes" page of the "Participant Database" custom service, find the POST /participants route and click the button to use it within a program:
On the next page, pick the program for the income assessment we created in Step 0 as the program to use the route within and click the "Continue: use route" button.
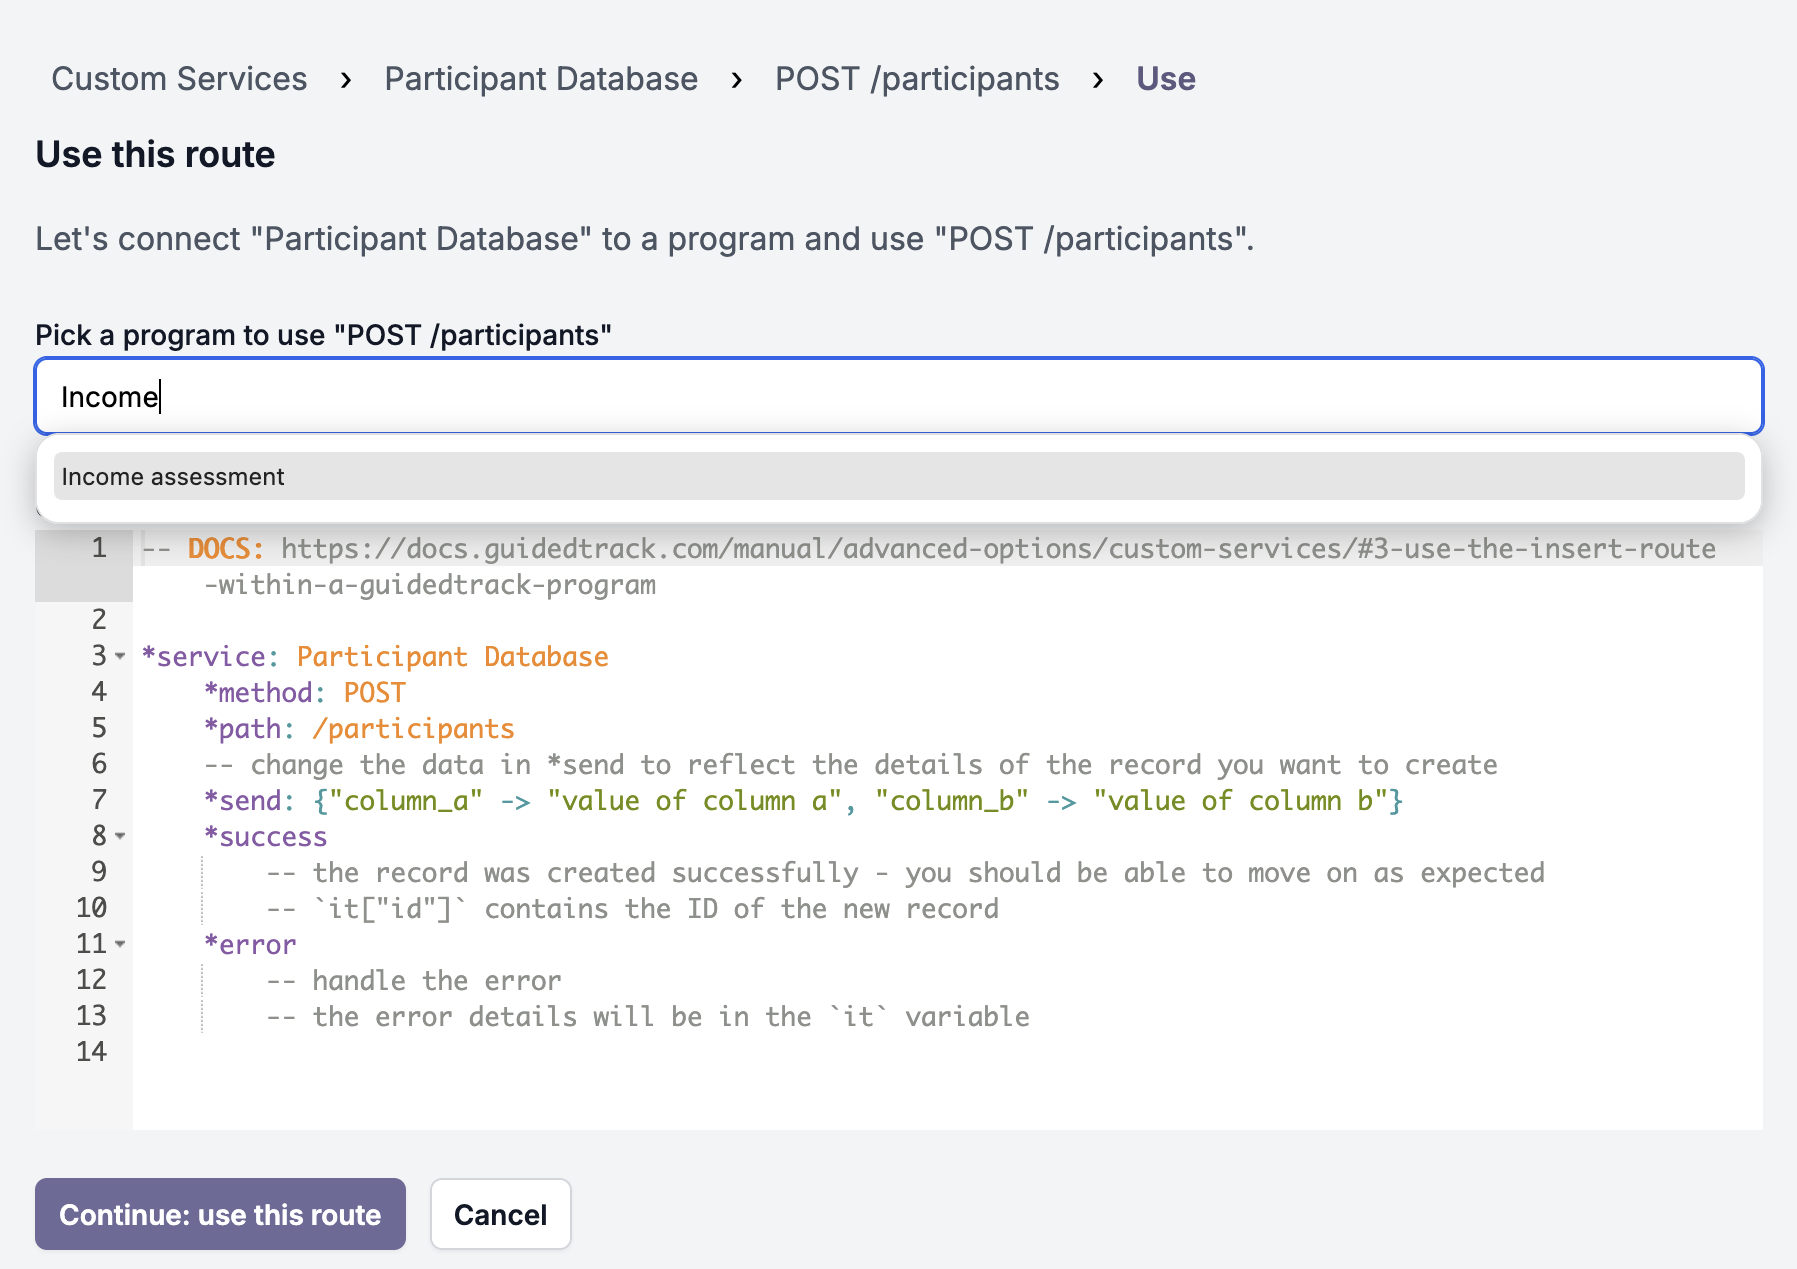
You'll be redirected to your assessment program with the code to add to the participants table ready to paste. Paste it before the code to report the income and edit the *send attribute to match the example below:
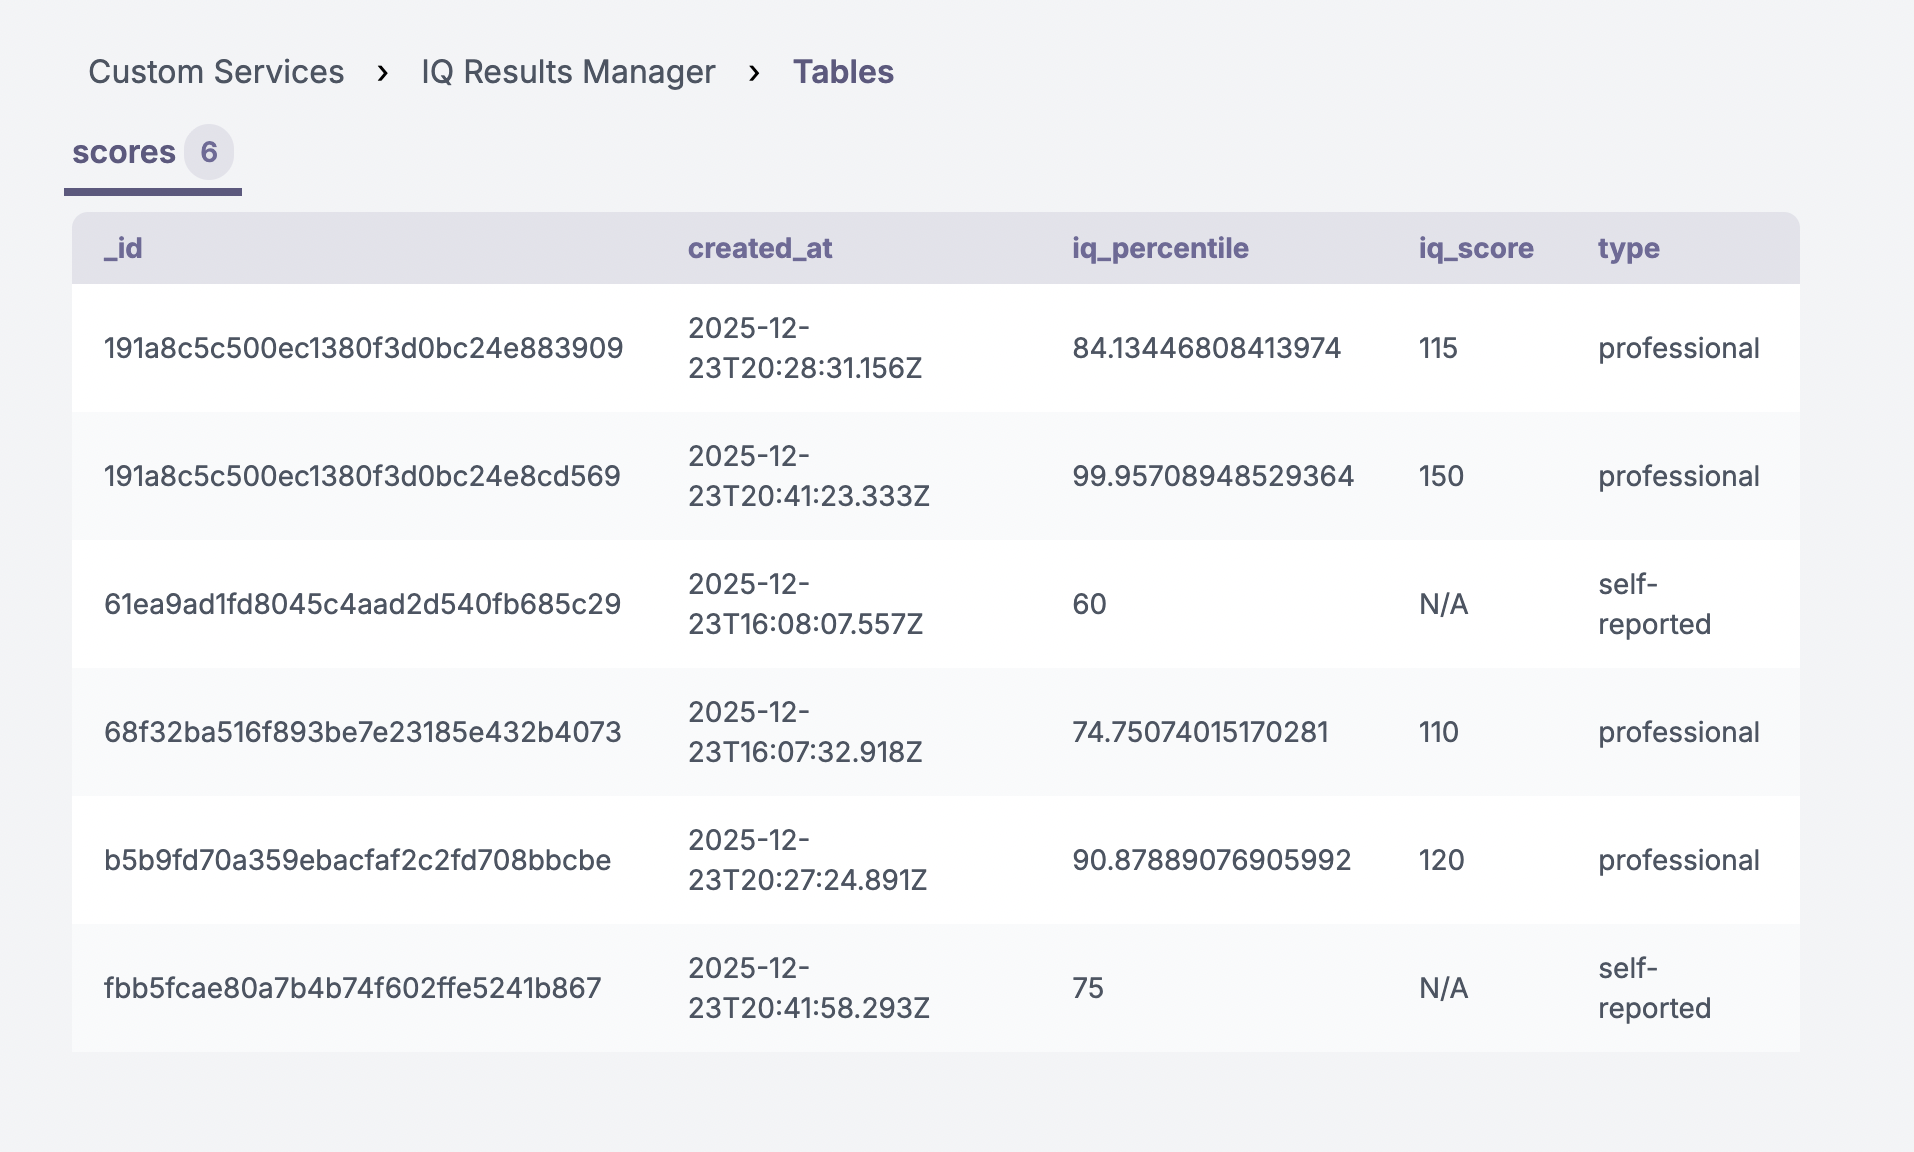
*question: How much total income in U.S. dollars did you *personally* make during all of last year (before taxes)? *tip: Just your own personal income, not your household income *type: number *before: $ *save: income *service: Participant Database *path: /participants *method: POST *send: { "income" -> income } *success -- saved successfully, do nothing *error You got an error: {it} You reported your income at ${income} per year.Your participant's incomes are now being saved to the participants table. You can view this data by navigating to the Custom Services page, finding the Participant Database service, and clicking "Tables."
You should then see something like this, after you've run the program 5 or 6 times:
Step 4: Create a route to retrieve the average income🔗
Now that we know the participants table will contain all of our participants' incomes, we can create a different route to calculate a income average and expose that to our assessment.
To do so, create another route in "Participant Database". Choose GET as the method and /incomes/average as the path:
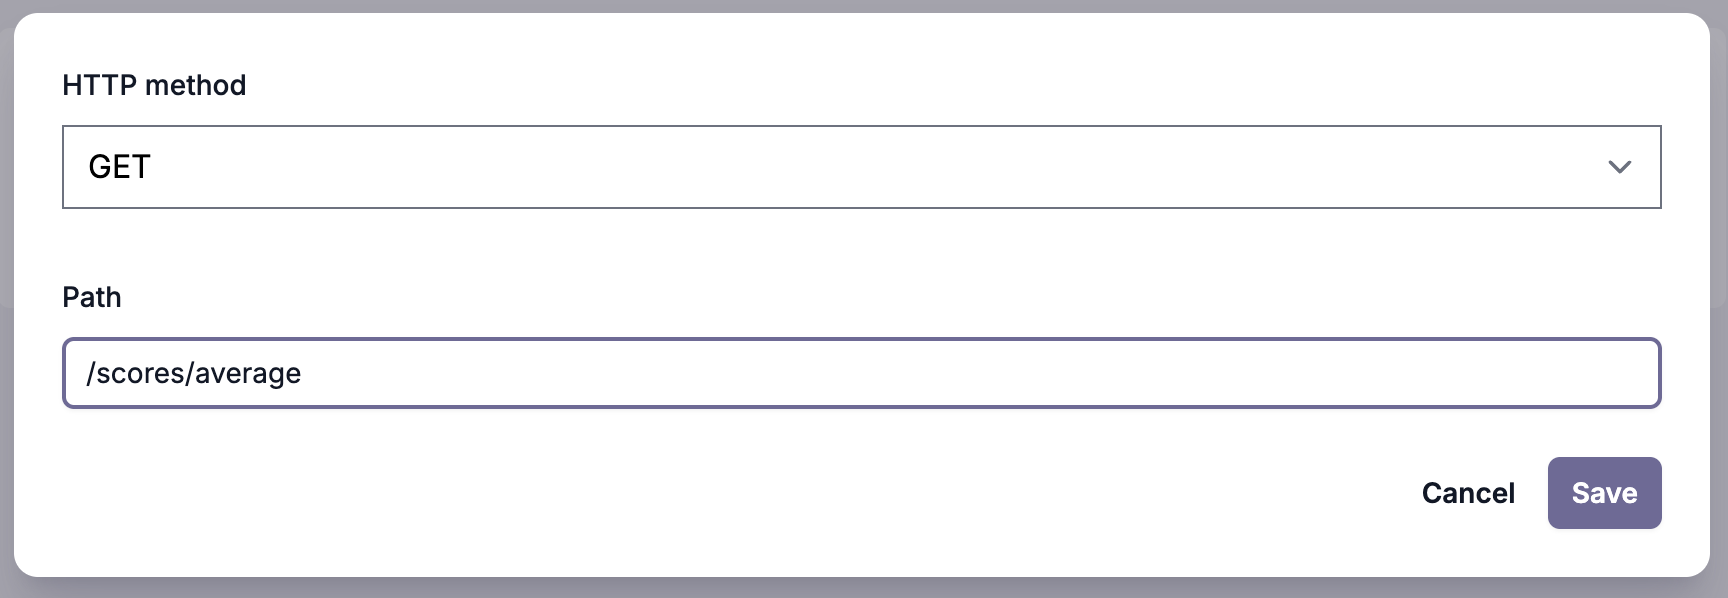
This route will find the last 250 participants, calculate their average income, and include the average in the response.
import guidedtrack from "guidedtrack-db"; export const handler = async (event) => { const incomeAverage = await guidedtrack.table("participants").latest(250).average("income") return { statusCode: 200, body: JSON.stringify(incomeAverage) };};Step 5: Display the comparison in your program🔗
Call the average income route from your program and show users how they performed compared to other recent test takers:
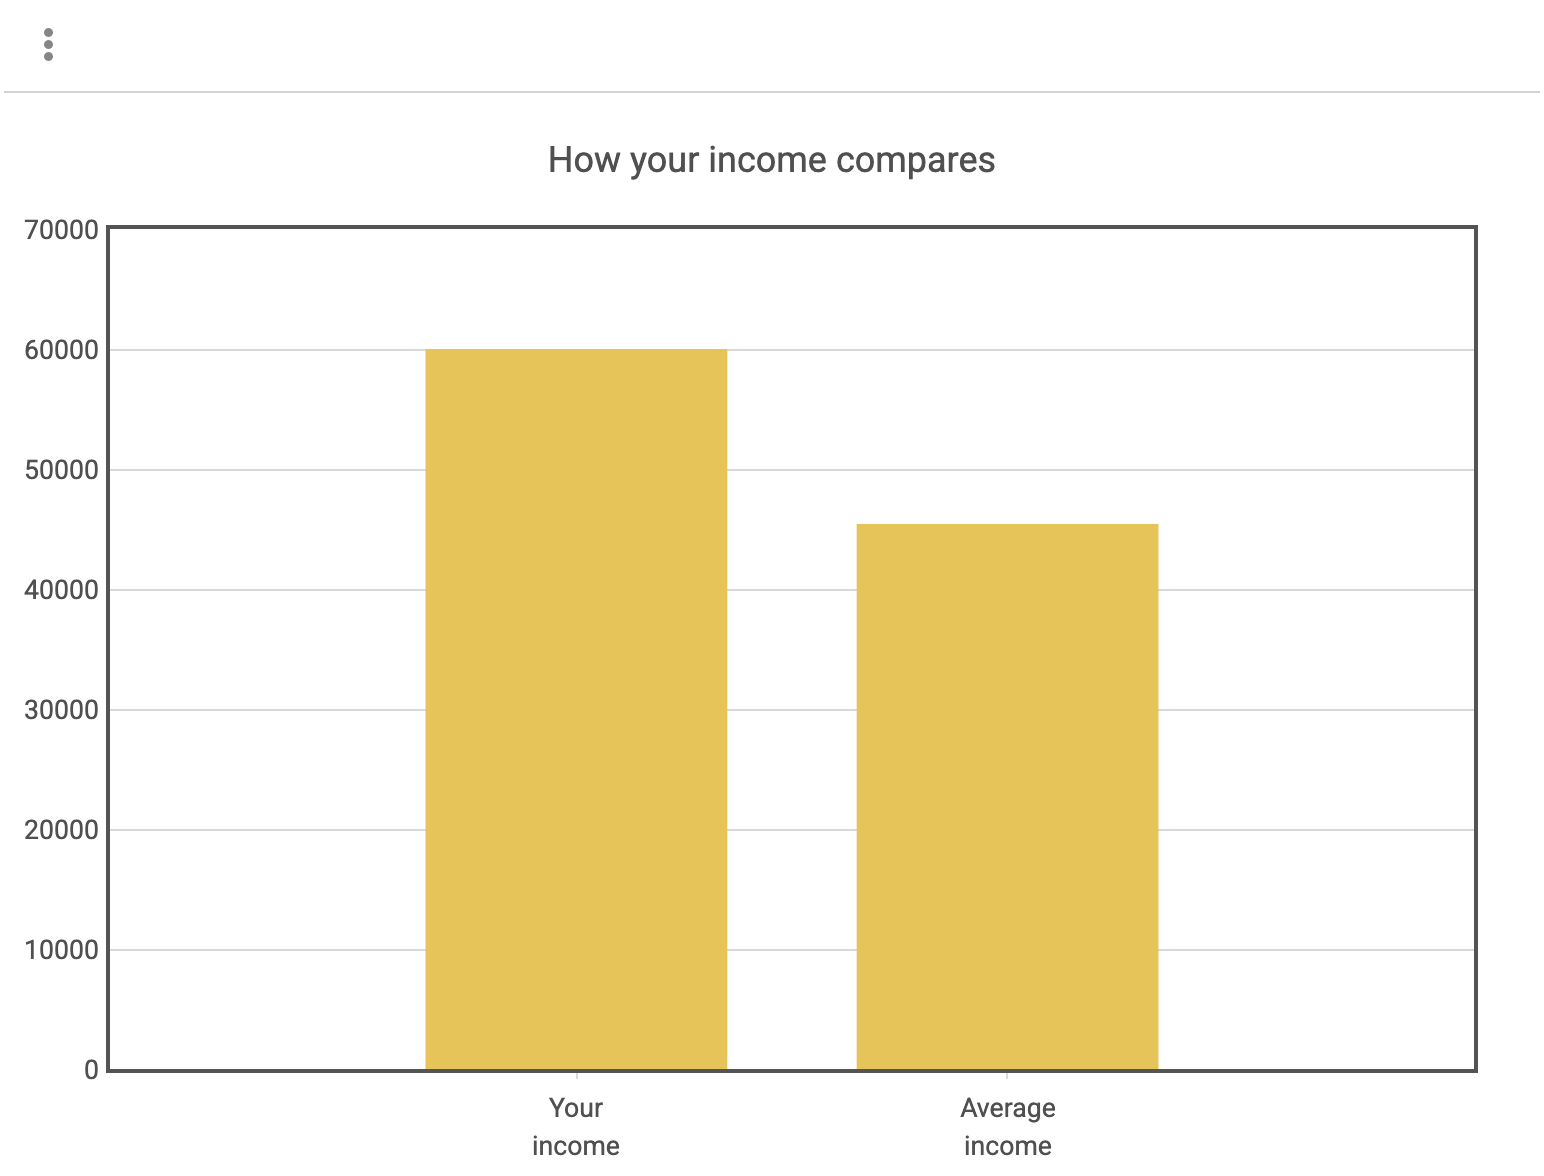
*question: How much total income in U.S. dollars did you *personally* make during all of last year (before taxes)? *tip: Just your own personal income, not your household income *type: number *before: $ *save: income *service: Participant Database *path: /participants *method: POST *send: { "income" -> income } *success -- saved successfully, do nothing *error You got an error: {it} Comparing your income to the average... *service: Participant Database *path: /incomes/average *method: GET *success >> averageIncome = it *error You got an error: {it} *clear *chart: How your income compares *type: bar *data: [["Your income", income], ["Average income", averageIncome]]Step 6: Test🔗
When you run your program now, the report will contain pertinent and valuable information about the participant's self-reported income:
Next: